
All of the reports are listed on the right side of the dashboard page. They are all generated based on the information entered within the top black navigation bar (dispatches, trips, invoices, expenses, and maintenances). All reports are generated based on DELIVERY date. Below is a list of all of the reports and their functionality, as well as where the information on the reports are generated from.
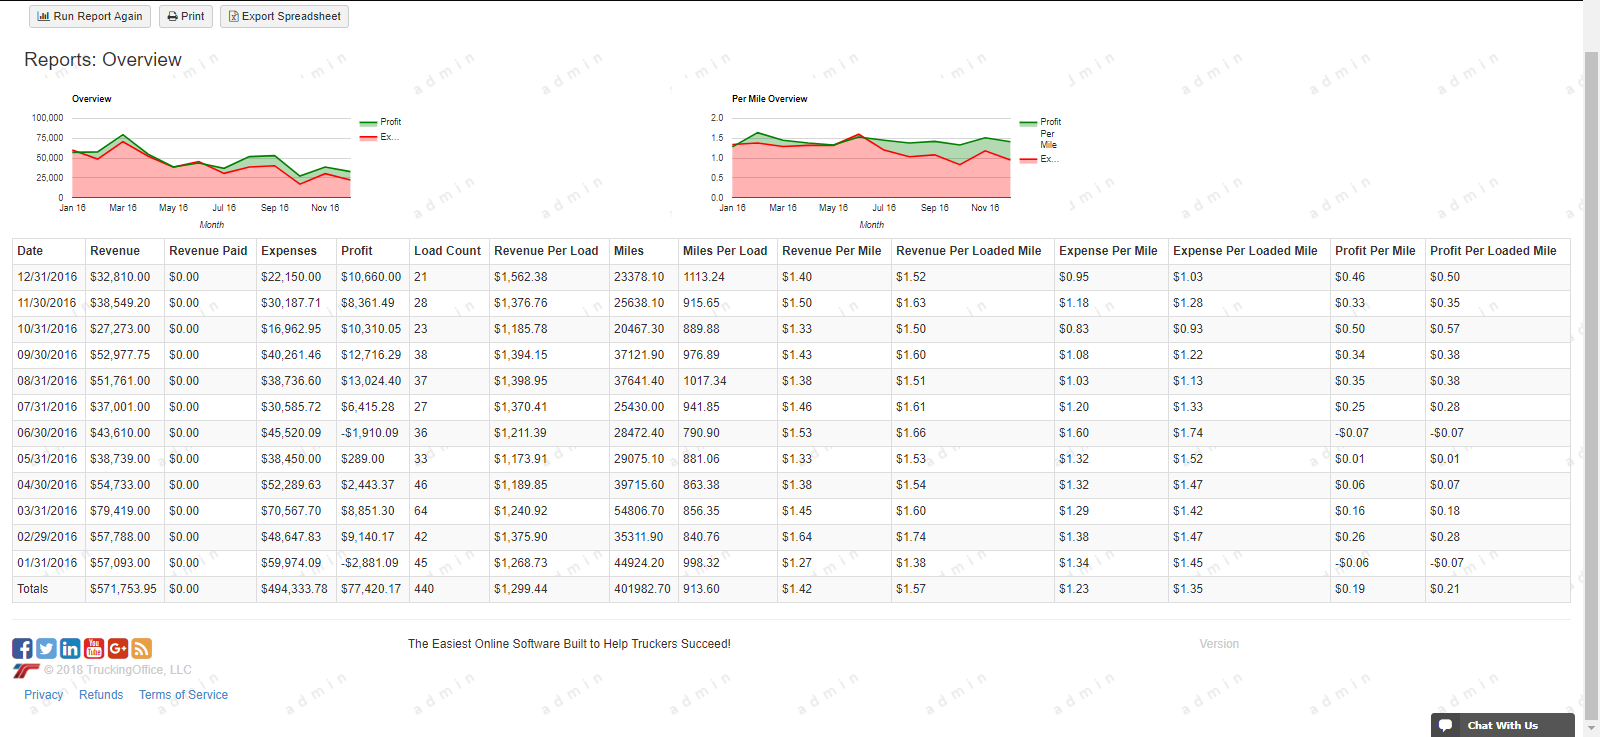
- Company Overview Report- This report can be generated monthly. There are 15 categories that his report lists.
-Revenue: this number is generated based on the information entered under "Fees/charges" including primary fee, accessory fees, and fuel surcharges.
-Revenue Paid: generated based on the invoices-the payments entered.
-Expenses: includes driver pay, invoice advance, fuel expenses and truck expenses.
-Profit: Total revenue minus expenses
-Load Count: Number of Loads within that month.
-Revenue Per Load: an average of all revenue for that month.
-Miles: The total number of loaded and empty miles
-Miler per load: the average of all miles within that month per load
-Revenue Per Mile: The total revenue divided by the miles.
-Revenue Per Loaded Mile: Total revenue divided by loaded miles only
-Expense Per Mile: Total expenses divided by the total miles
-Expense Per Loaded Mile: Total expenses divided by loaded miles only.
-Profit per mile: Profit (revenue minus expenses) divided by the total miles.
-Profit Per Loaded Mile: Profit (revenue minus expenses) divided by Total loaded Mile
Comments
0 comments
Please sign in to leave a comment.